
Match insights provides a quick overview of the results returned by the YARA search. Insights can be used to identify trends in the results as well as filter the matches table.
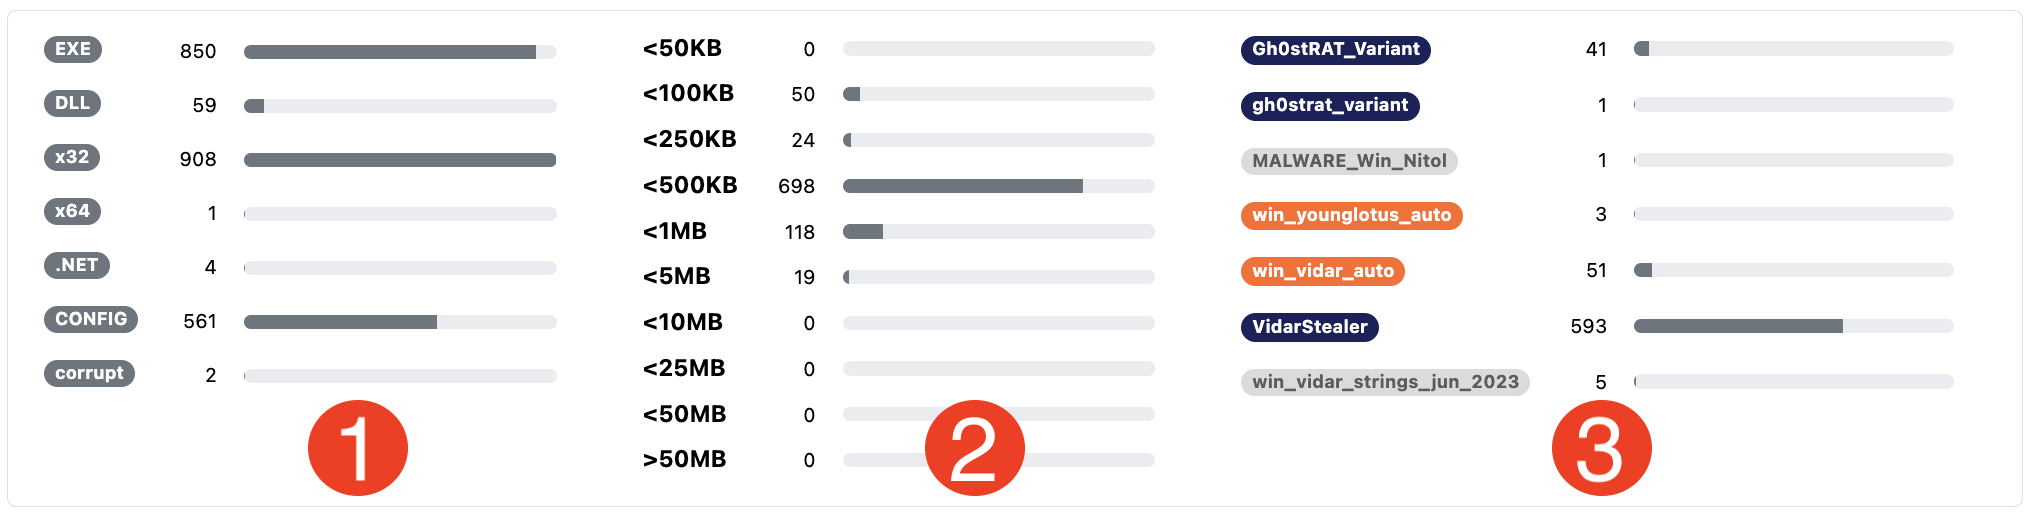
1. Tags
The tags distribution graph displays a list of tags assigned to the YARA matches and their frequency in the results. Each tag can be clicked to add it to a filter for the matches table.
2. Size
The file size distribution graph categorizes the file size of the search matches. File size is a powerful indicator of similarity and the size distribution graph can provide quick insight into the similarity of the results.
3. YARA Labels
The YARA distribution graph displays a list of YARA labels associated with the YARA matches and their frequency in the results. Not be confused with the YARA search rule these labels are labels that have been automatically applied to the samples by the UnpacMe platform. Each YARA label can be clicked to add it to a filter for the matches table.
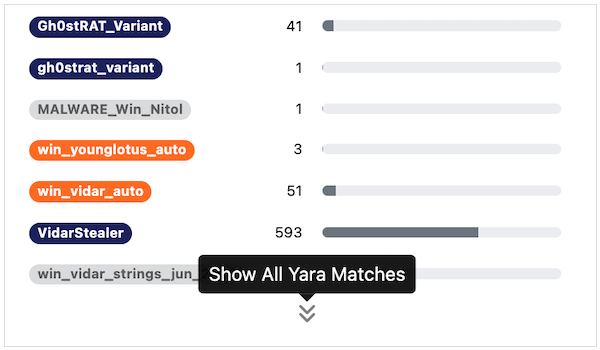
The default YARA distribution graph will display seven labels. If there are more than seven labels a drop down arrow will appear which can be clicked to view all labels.